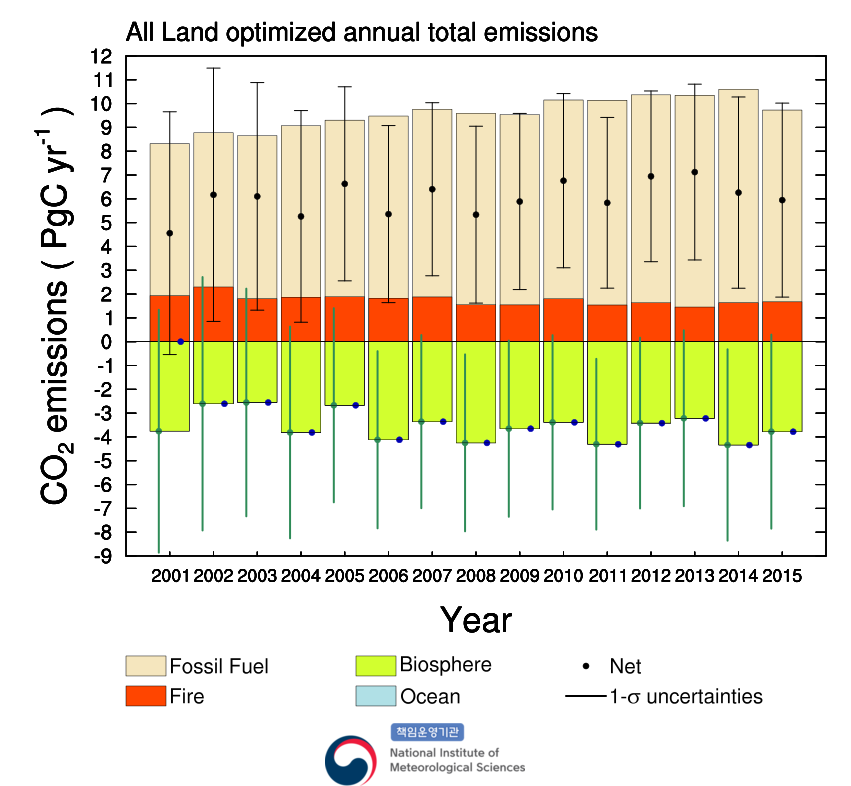
Annual total emissions for each Transcom region. The bars represent CO2 total emission and uptake for each year. Positive value means CO2 emission and negative value is opposite. The color of the boxes indicates the type of the flux. fossil fuel (tan), terrestrial biosphere (green), ocean (blue), wildfire (darkorange). Net surface flux is denoted as black dot. The lines indicate uncertainty of the fluxes which is given as 1-level ensemble standard deviation. Note that flux at 2015 is aggregated for 2015.01.01.~2015.11.27.