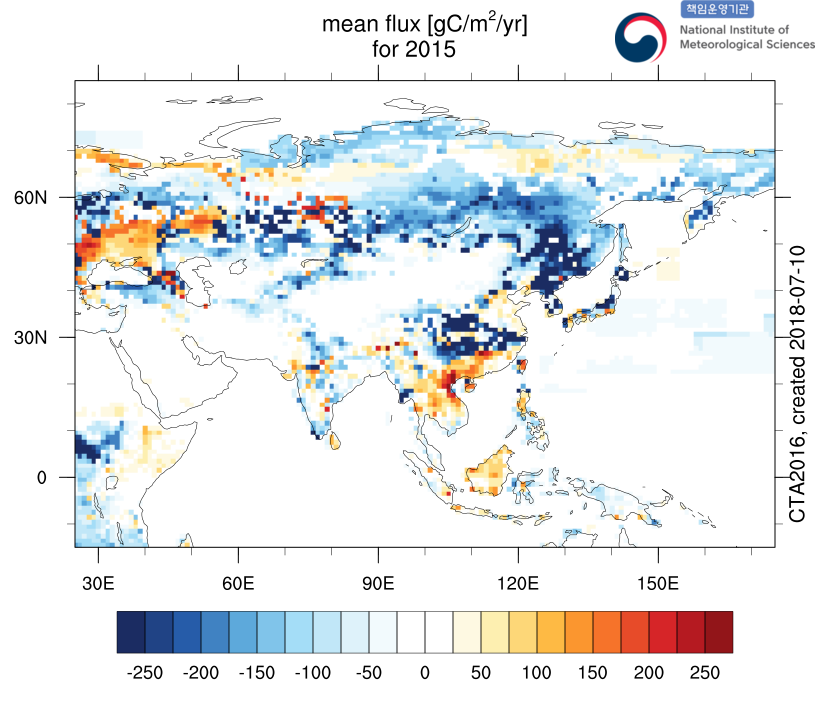
Left Panel : The mean flux for the time period indicated. Negative fluxes (uptake) are displayed in blue colored pattern. Positive fluxes (emission) are red colored pattern. Units are gC/m2/yr. The figures include biosphere and ocean fluxes. No fossil fuel and wildfire included.
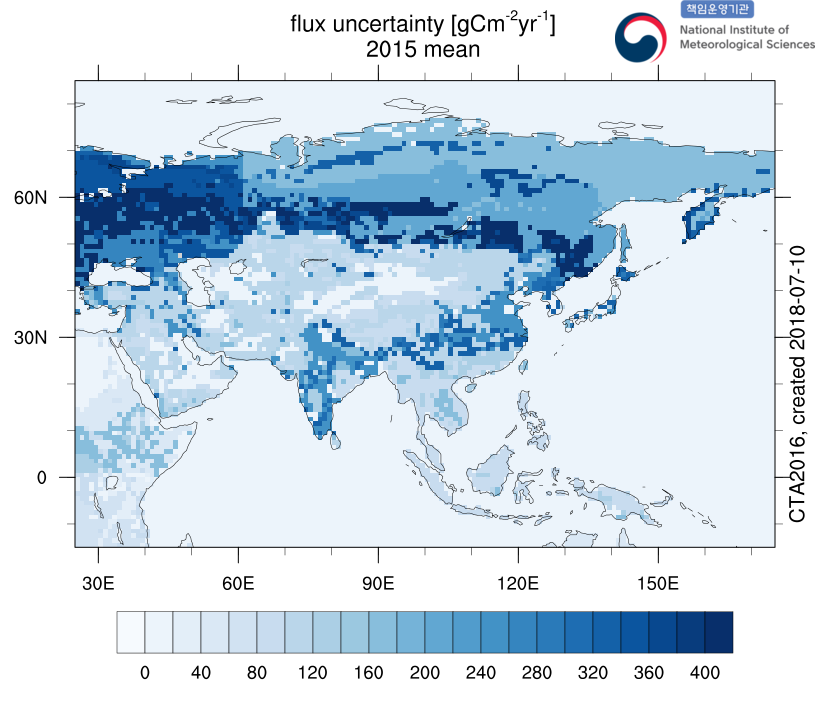
Right Panel : The uncertainty on the optimized fluxes. The uncertainty is given as 1-level ensemble standard deviation.